
The Weather Insights Platform™(WIP™) is a dynamic, web-based application designed to provide a competitive edge for retailers, restaurants, and e-commerce organizations.
Businesses can leverage WIP to optimize business performance using actionable weather insights based on hyper-local weather data that will generate actionable insights on product sales, inventory management, seasonal product rotation, advertising & marketing, and more. WIP is a single pane of glass platform that adds value to your data to help optimize business operations.
Traditionally retailers have based sales forecasting on historical transactional data which in most instances does not factor in the influence of weather on sales, footfall traffic and customer behavior. With WIP it is possible to automatically correlate historical weather data with internal sales transactional data to find signals that will enable the generation of actionable weather insights specifically tailored to a customer’s precise business locations.
- Sales Forecasts | Generate a weather and non-weather influenced 46-day product sales forecast by SKU, brand, category, cost center, etc. WIP makes it easy to generate seasonal and sub-seasonal product forecasts.
- Historical Analysis | Statistically analyze historical data to generate insights on type of weather parameter (i.e., wind, rain, snow, etc.) to understand how demand is increasing or decreasing compared to historical sales and quantify the impact the weather condition has on a specific product.
- Weather Triggered Promotions | Generate actionable marketing intelligence as to when to expect increases or decreases in footfall traffic or product sales as a result of weather. Initiate weather triggered marketing campaigns that serve ads based on predetermined weather triggers and the forecasted weather.
- Visualization Dashboard | The easy and intuitive user interface visualizes all of our business locations and insights with the ability to drill down to individual store locations, regions, products, forecasts, etc.
- Insights using your data | WIP was designed to be deployable in any cloud or on-premises environment. WIP’s scalable cloud-based architecture makes it easy to onboard your first party data using tools from industry standard data repositories such as Google BigQuery, Snowflake, AWS S3 Storage and SFTP.
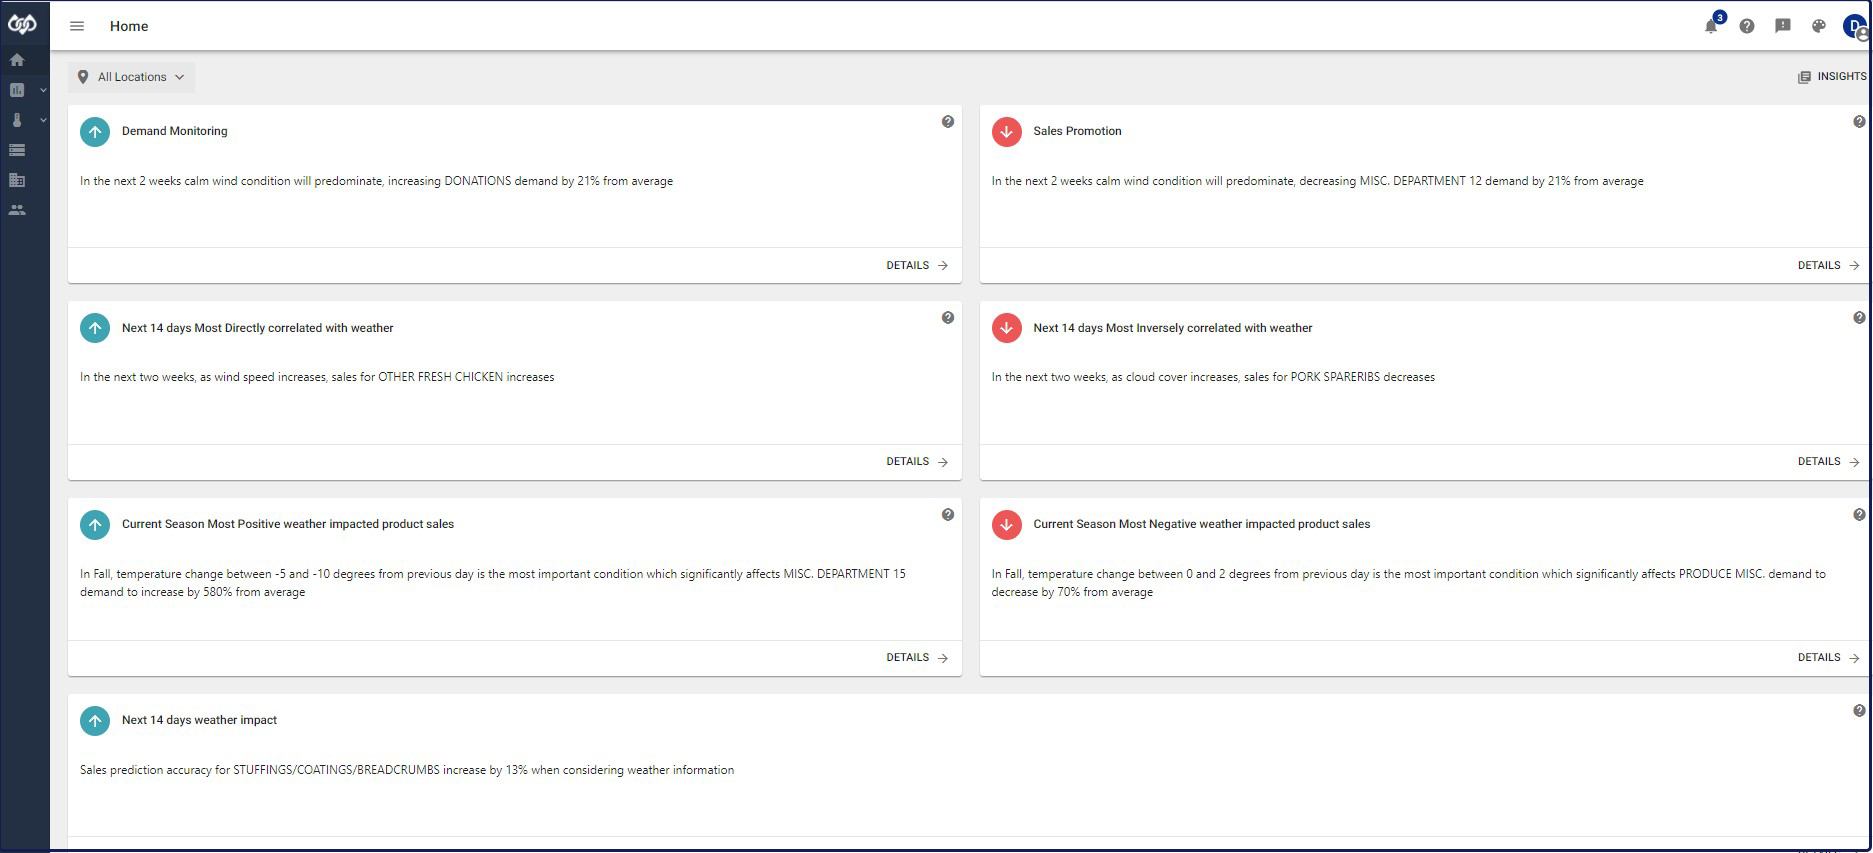
The WIP home page provides an instant snapshot of the statistically analyzed insights by relating the customer’s data with weather data.
This view details the next 46 days of Weather Correlated Demand by product category.
This insight shows the correlation between product sales and different weather parameters for all historical sales and weather data that falls in the next 46 days. It gives insight into sales of product categories and the items within those categories as well as their correlations with different weather parameters.
Also included is Historical Weather Correlated Demand. This table shows the Pearson correlation coefficient between product sales and different weather parameters for each month. The up and down arrows are used for showing higher positive and negative correlations.
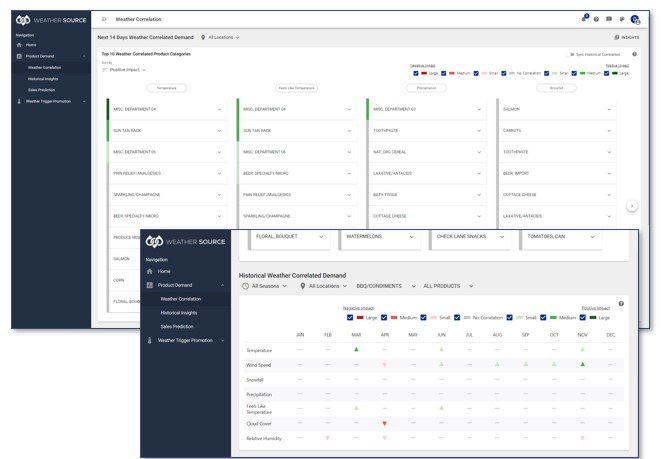
Know what products are significantly statistically correlated to weather for each season and store.
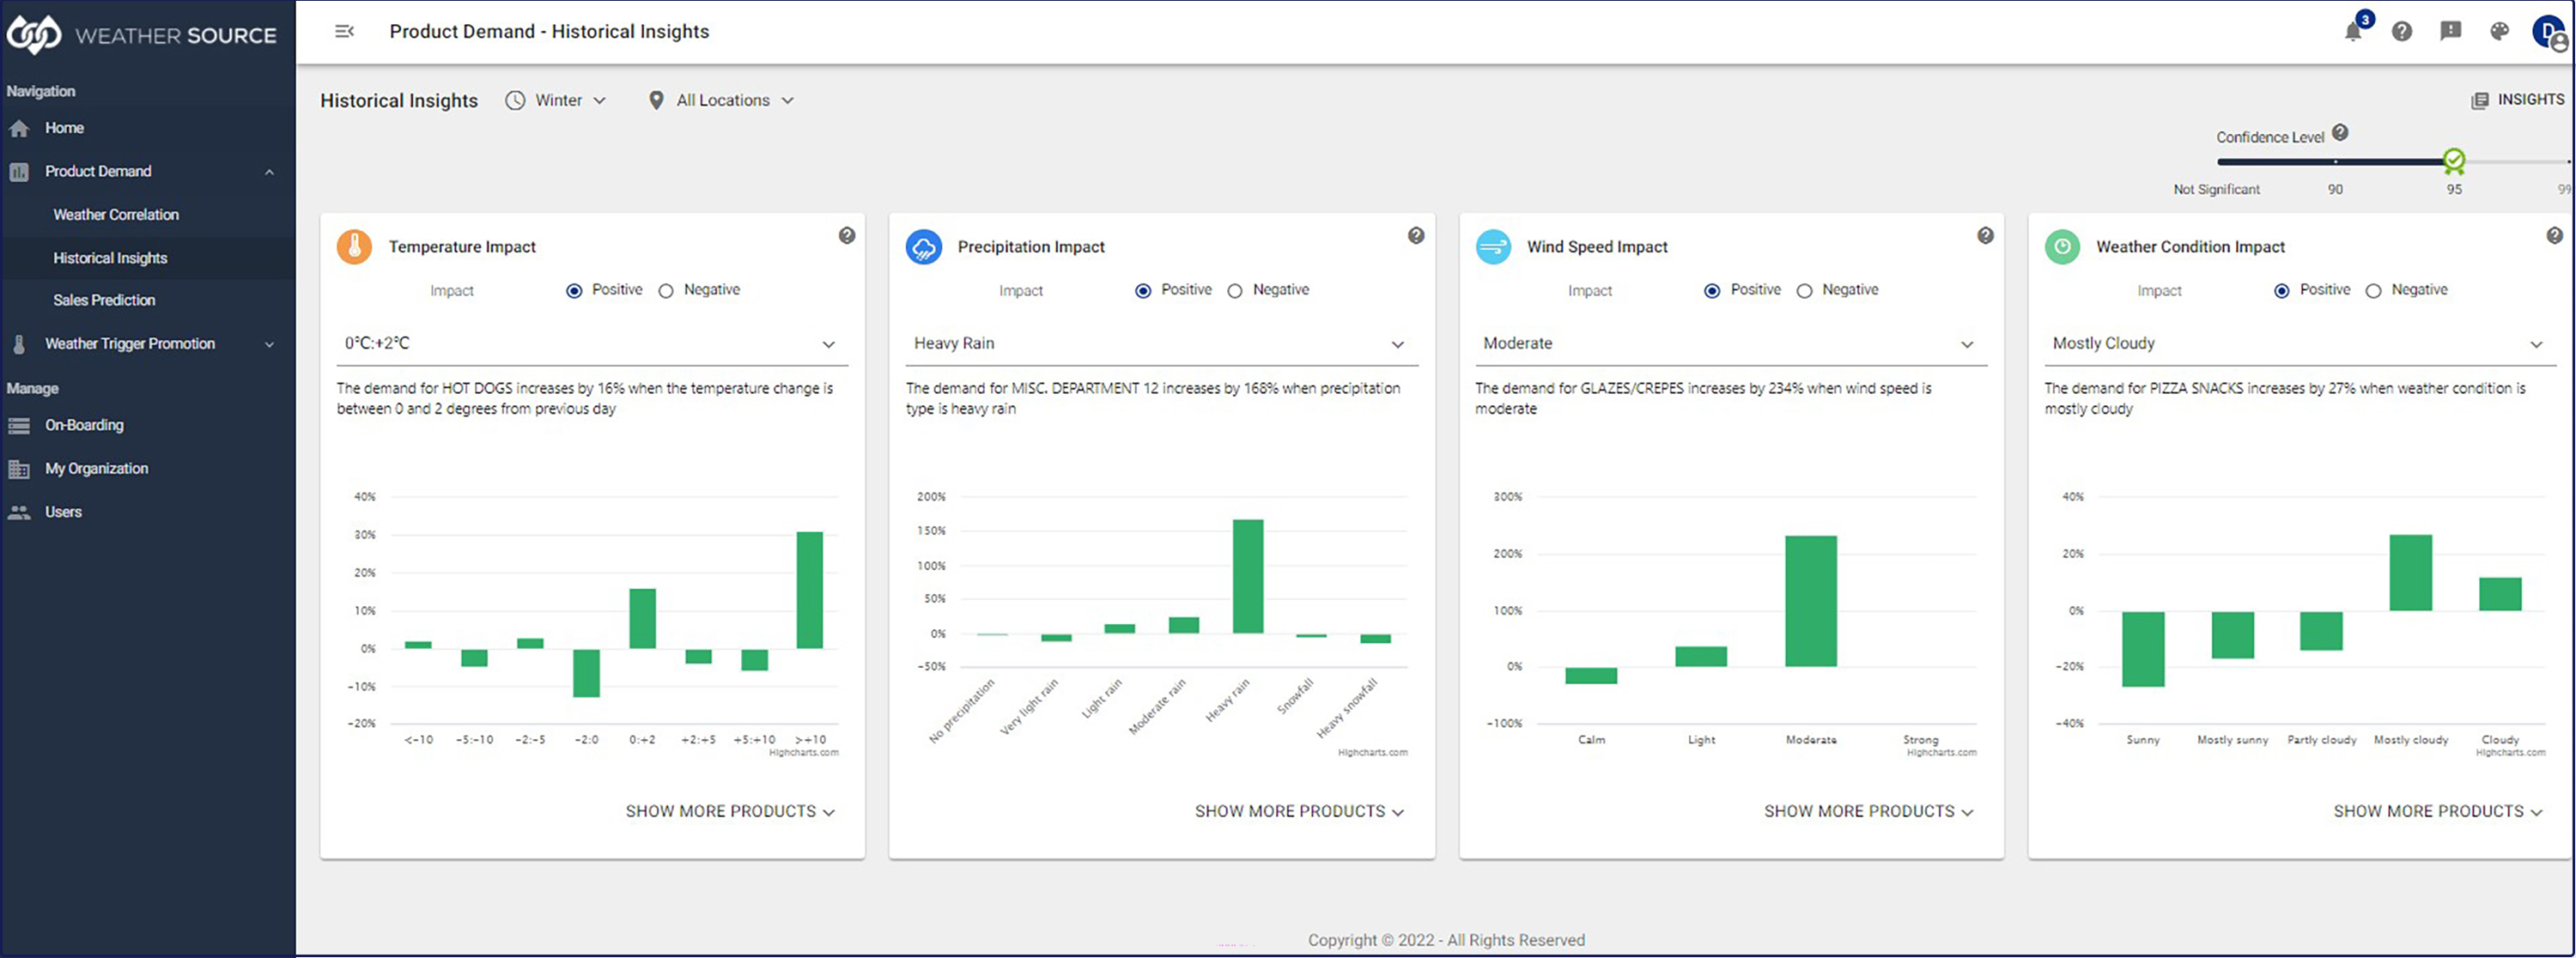
Temperature Impact | This insight shows the percentage of change in product demand correlated with temperature change.
Precipitation Impact | This insight shows the percentage of change in product demand correlated with precipitation.
Wind Speed Impact | This insight shows the percentage of change in product demand correlated with different wind speed categories.
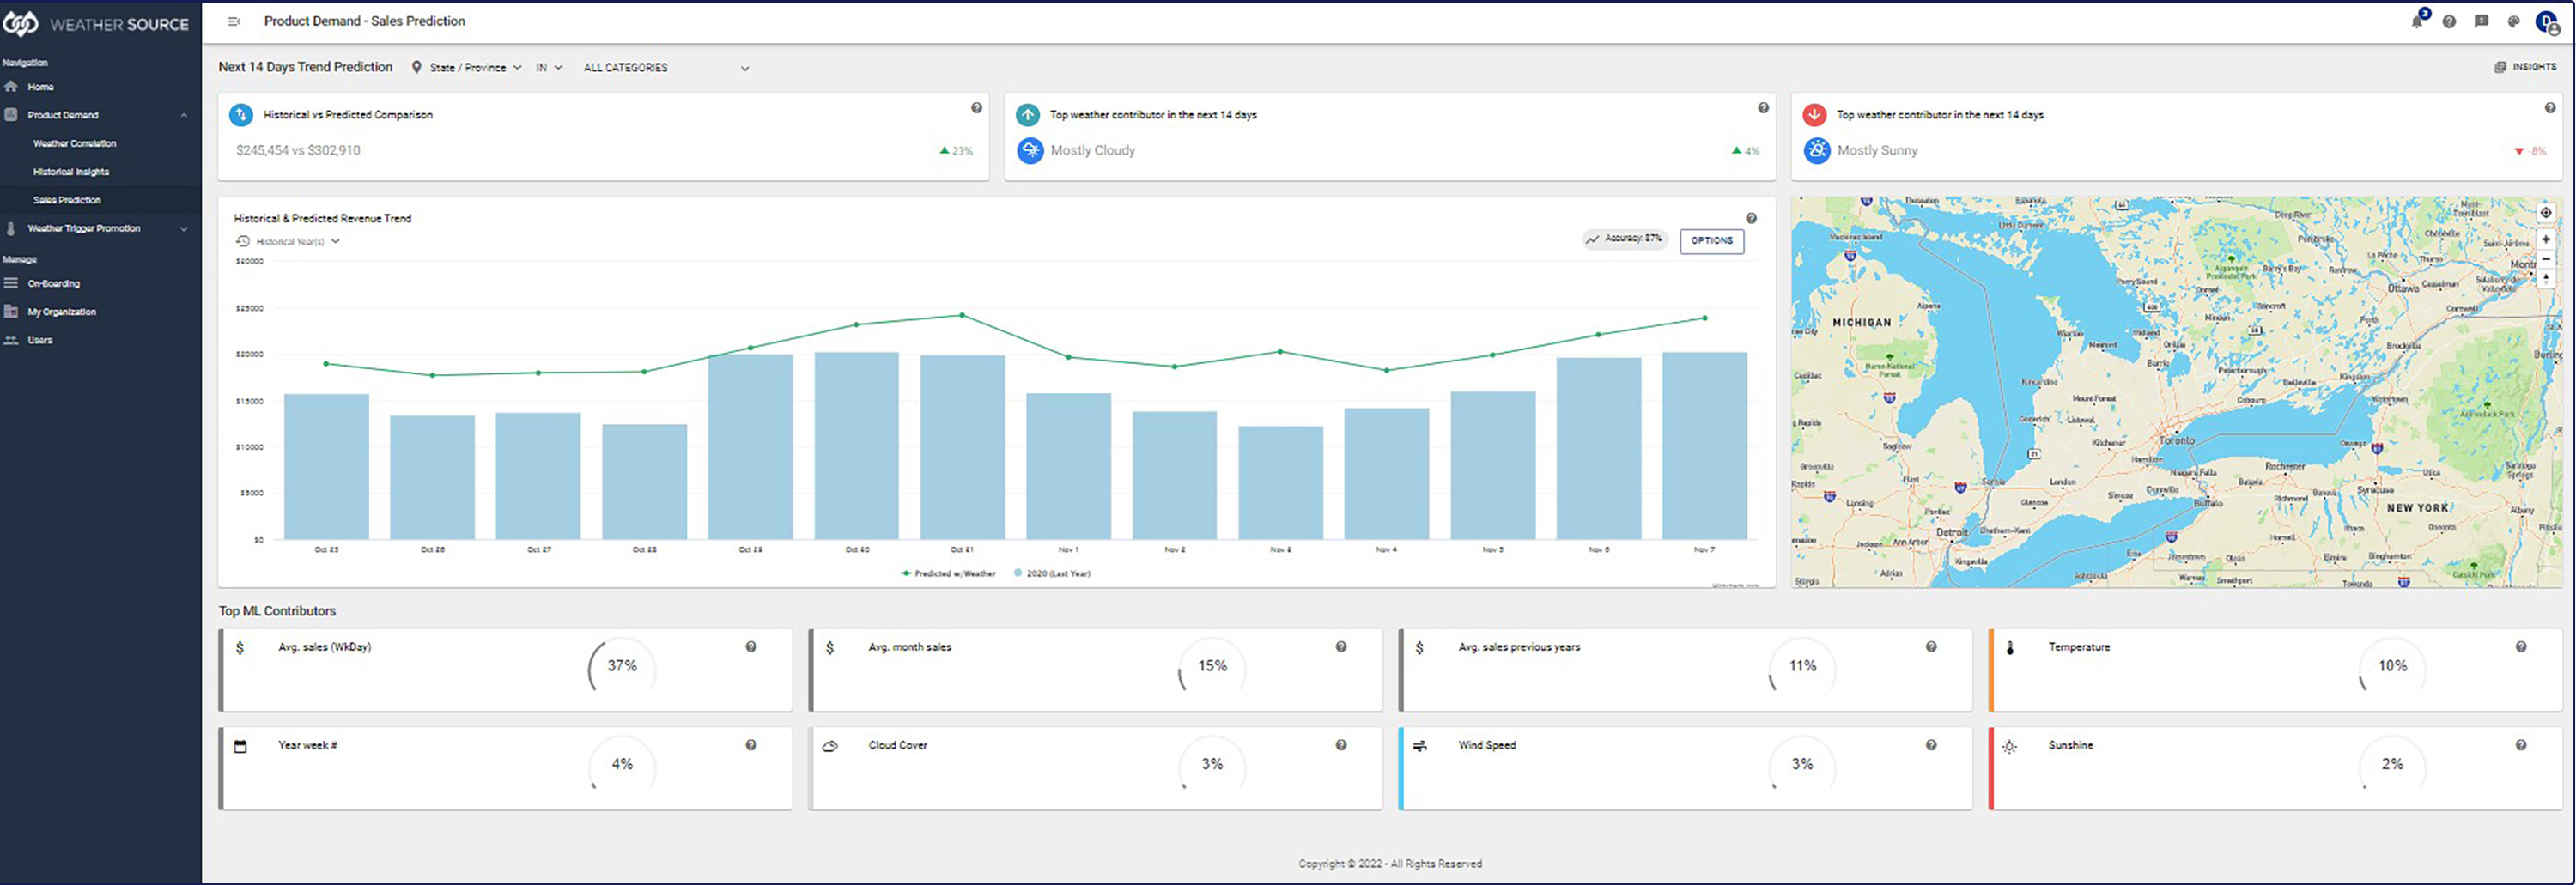
This view details the next 46-day trend prediction for the following entities:
Forecast vs Historical Comparison | Provides the comparison between the total predicted sales and the total actual sales using the same time period for the present year and previous year. This also shows the percent difference between the total amount of predicted and historical sales.
Historical & Predicted Revenue Trend | This chart shows the next two weeks’ sales predictions along with the previous year’s actual sales data for the same period.
Top Machine Learning Contributors | This shows the top eight variables along with the magnitude of their attributions which are used in a machine learning model to predict the next 14 day’s sales. This includes non-weather parameters (sales and time) along with weather parameters impacting the sales prediction.
Weather Trigger Promotion is key to capitalizing on sales related to specific weather events.
Promoting Insights | This section enables users to select a product category, view how weather impacts that category and then select the promoting destination – Google DV360, Google Apps Manager (GAM), Meta ads or any other loyalty or ad platform that allows access via an API. Users may choose the season to view and the location by state or store. Initiate ad campaigns when WIP recognizes demand for a product based on forecasted weather.
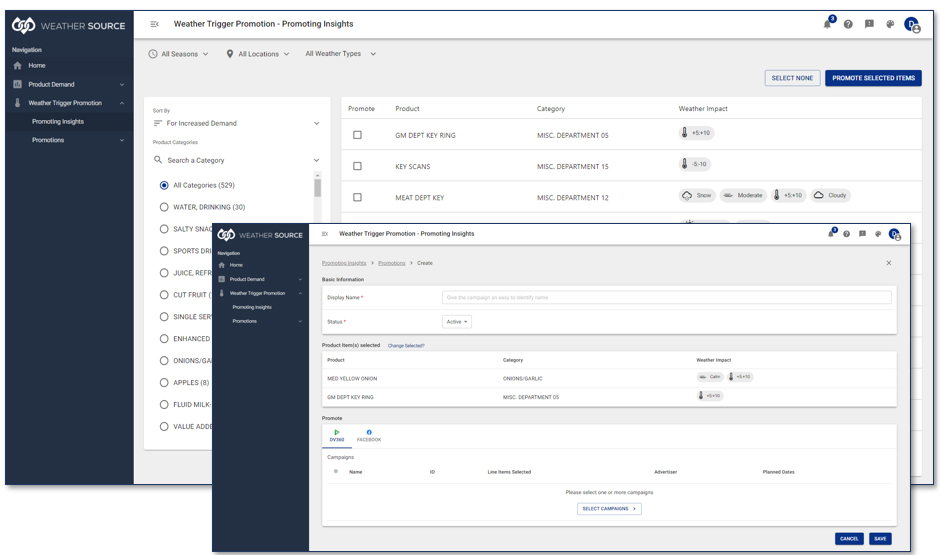
Optimize Product Promotion
Know when to initiate product promotions and marketing campaigns for specific products that are positively or negatively affected by weather conditions. Our Condition-based Ad Triggering (CBAT) can help launch marketing campaigns into platforms such as Google DV360, Google Apps Manager (GAM) and Meta ads.
Understand Product Demand
Leverage WIP to track operations and sales against weather and ultimately to increase revenue. Plot and track assets and locations to understand how each is affected by weather. Create sales forecasts, review model performance, quantify the impact of weather on sales, and more with easy-to-use modules accessed via a single dashboard. An example of the insights that you will be able to find using our WIP solution is wine from the United States sells better when it is raining than wine from Spain.