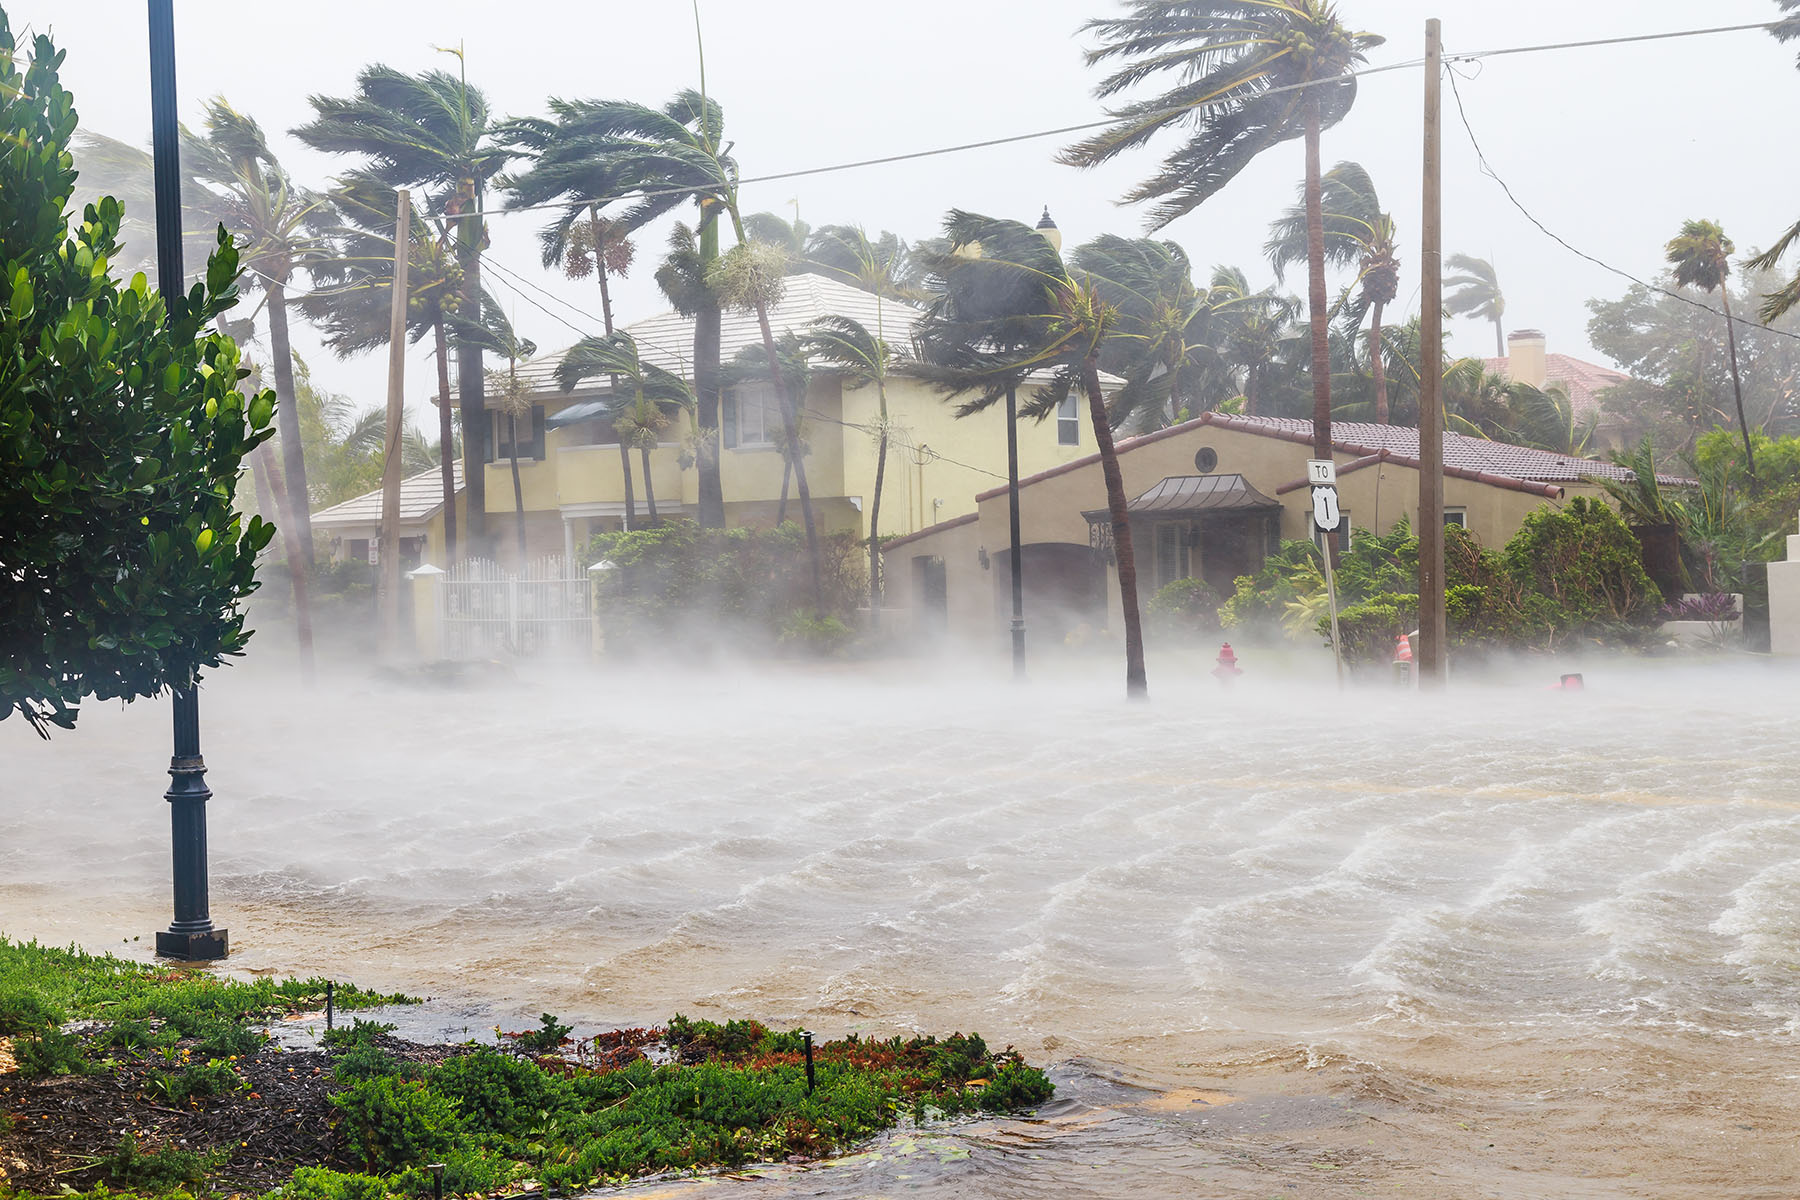
Just when you thought hurricanes couldn’t get any worse…think again as it seems that this year will be another one for the record books with above-normal activity. The 18th named Atlantic storm, Sam, is currently making its way through the Atlantic as a Category 4 hurricane, although the immediate threat to land seems to be waning, a Tropical Storm Watch has been issued for Bermuda for the next 48 hours.
If we compare this year to last year’s record-breaking 1% hurricane year, 2021 has been nearly as active. Although we are currently slightly behind on named storms, we have already tied 2020 for hurricanes. We are actually ahead of last year when comparing major hurricanes, and we aren’t even close to the end of the season, as September and at least the first three weeks of October are infamously busy.
NOAA scientists previously predicted that the likelihood of an above-normal 2021 Atlantic hurricane season is 65%. “A mix of competing oceanic and atmospheric conditions generally favor above-average activity for the remainder of the Atlantic hurricane season, including the potential return of La Nina in the months ahead,” said Matthew Rosencrans, lead seasonal hurricane forecaster at NOAA’s Climate Prediction Center.
Looking back, only five hurricane seasons on record have had at least 12 named storms by the beginning of September, the 2021 Atlantic hurricane season with 20 named systems is the third most active behind 2020′s record year and 2005. Of the 12 named storms, five have become hurricanes, and three of these reached major hurricane status by becoming at least a Category 3 with maximum sustained winds of at least 111 mph.
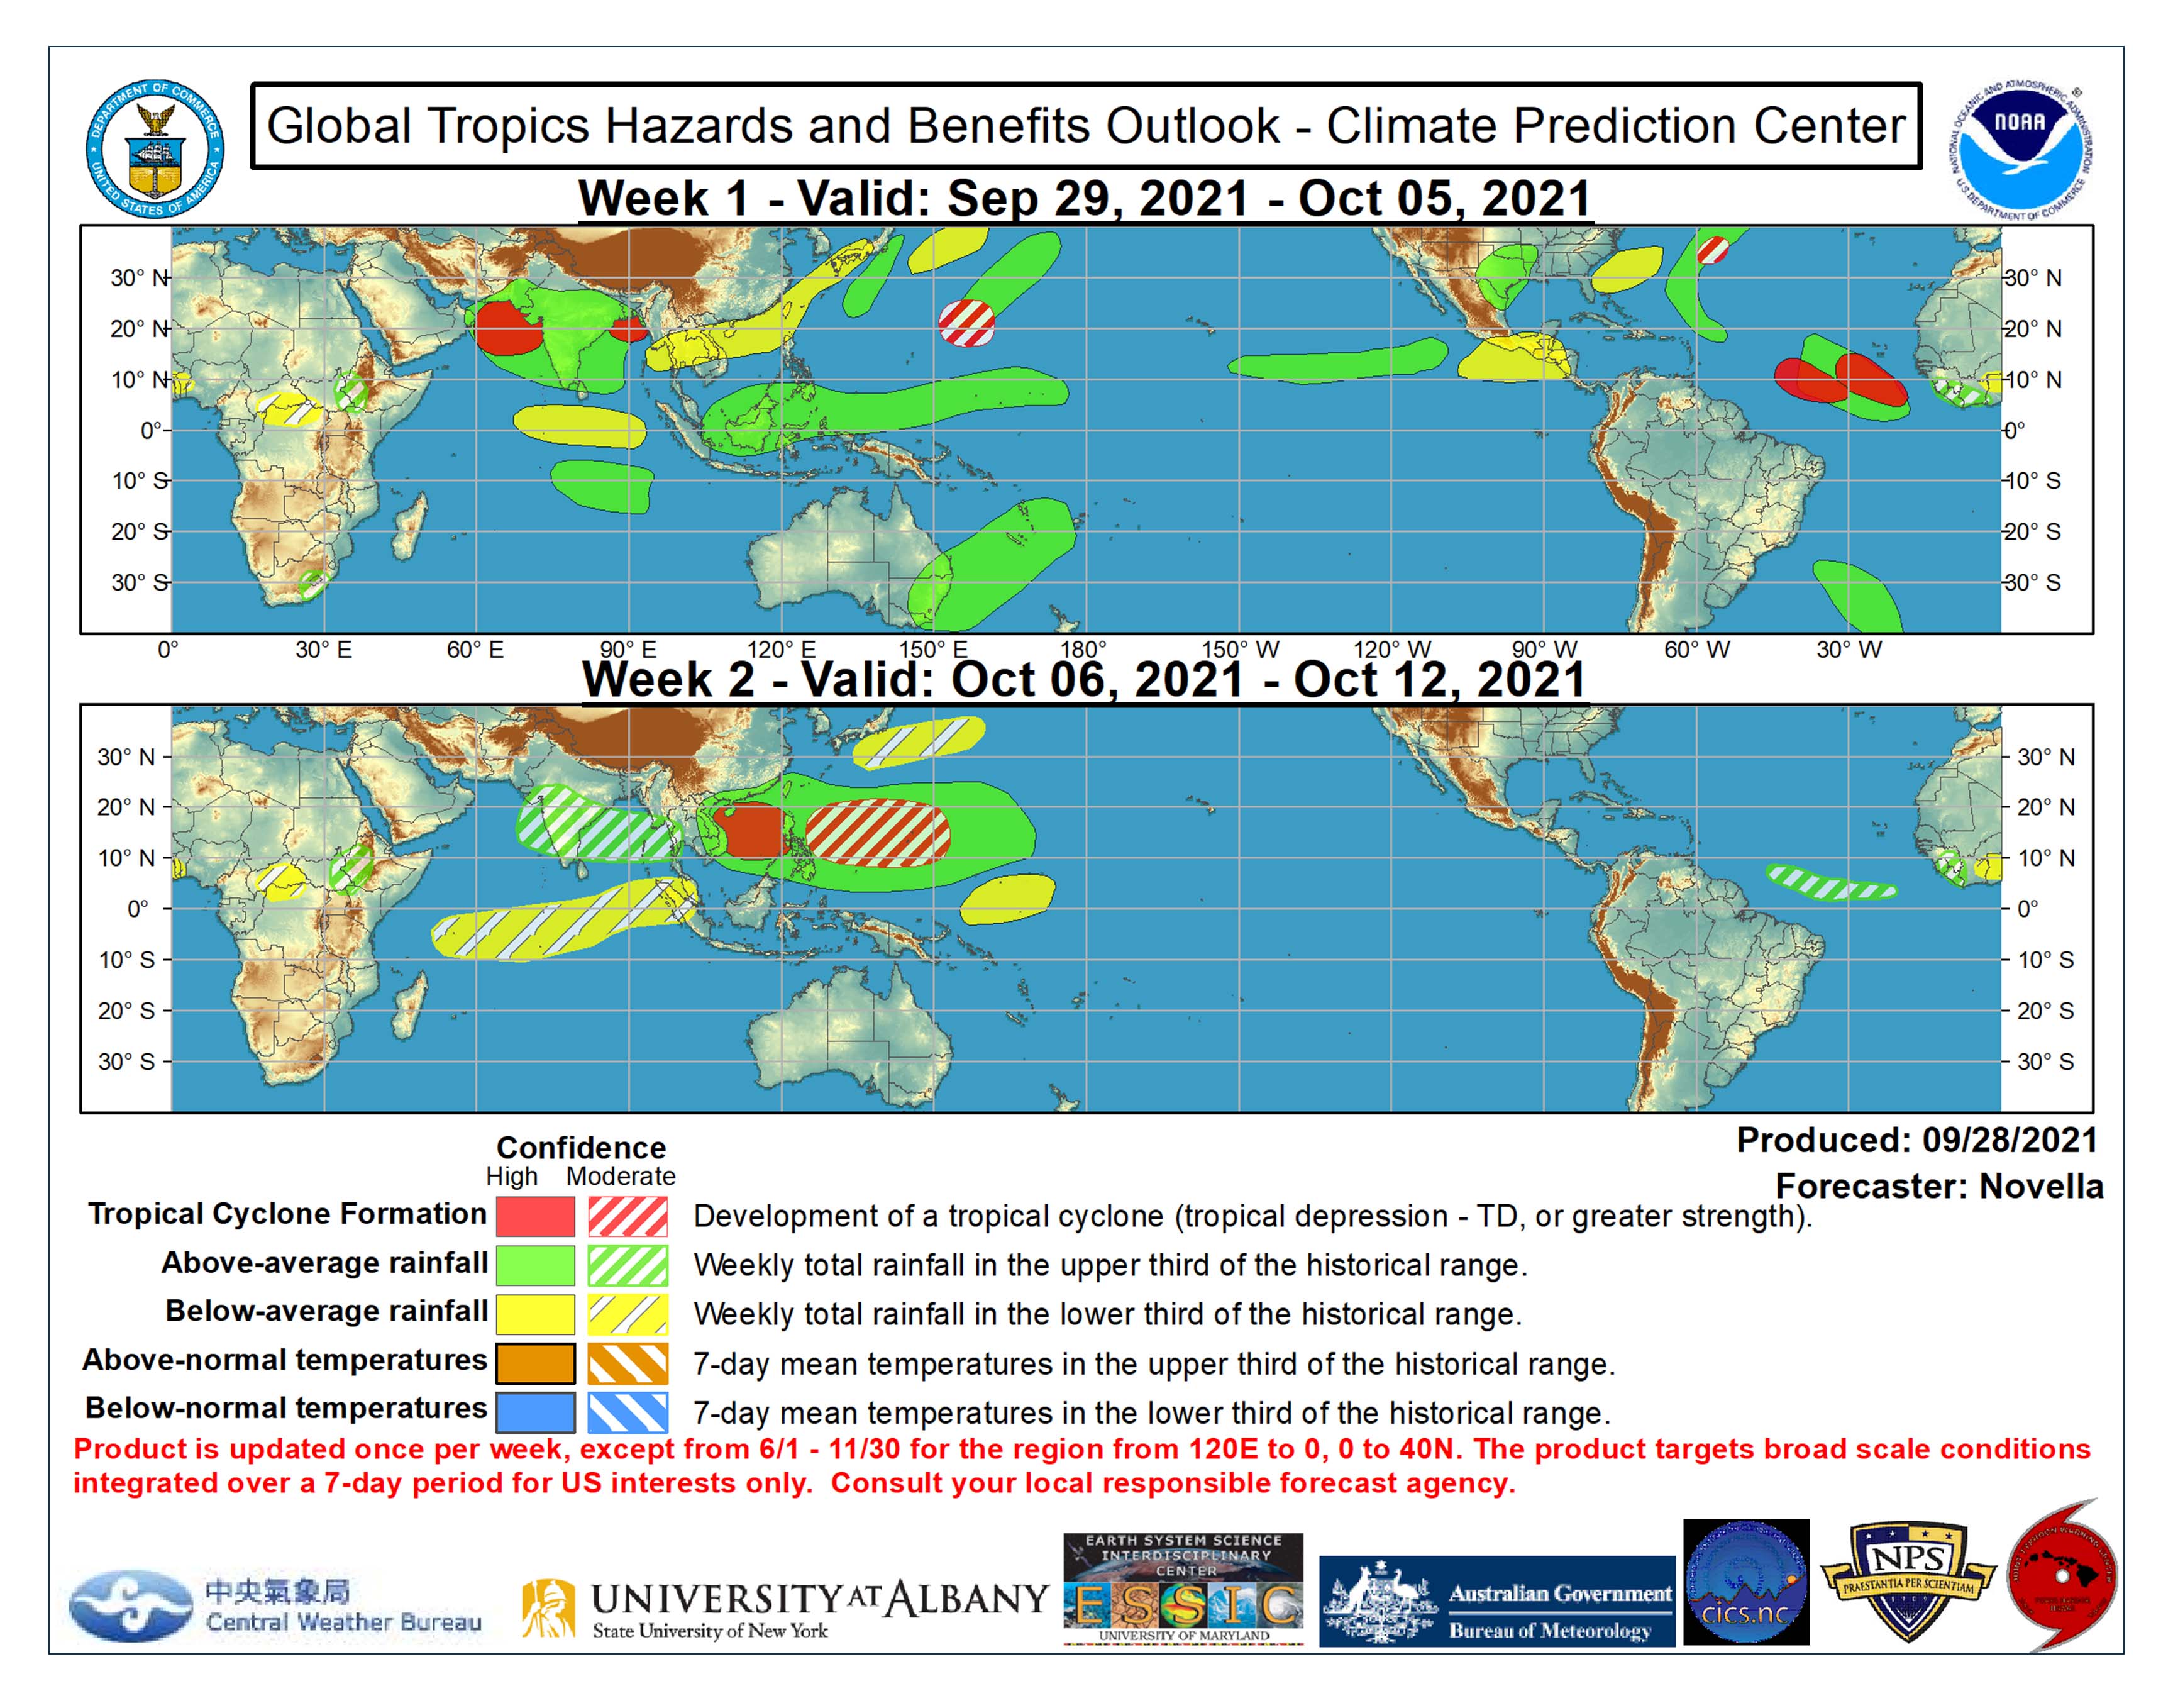
The images below from NOAA depict current storms in the Atlantic and the potential for storms.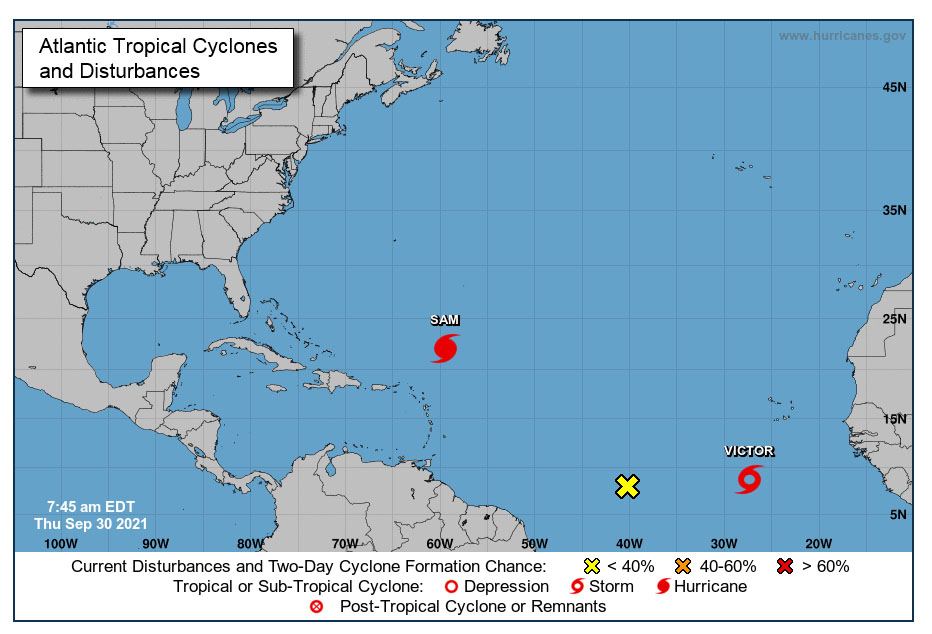
As the frequency and severity of hurricanes [and tropical storms] grow in number, the importance of preparedness for communities and businesses does as well. For consumers and businesses in frequently hit areas and also for those that are affected by storms, it is essential that they build weather strategies to mitigate risk and ensure they can still meet the needs of the consumers they serve (i.e., pre-staging inventory outside of the impact zone, etc.).
For instance in the Southeast, which is continually affected by hurricanes, businesses need to plan not only for damages but also for their products and inventory as they need to have essential items, such as CPG’s, in store for consumers to stock up on in times of emergency.
Recently, Weather Source performed an analysis with our partner SeekData for a Snowflake Webinar “Retail and CPG Data Analytics Forum.” During the webinar we examined peanut butter sales as Hurricane Ida traveled across Florida and the rest of the Southeast in 2017. The story is very compelling and the demonstration clearly showed a massive increase of peanut butter sales that started upon the first forecast of a hurricane when it was 120 hours from making landfall. The buying activity continued to increase as the forecasted hurricane approached land. Note the images below:
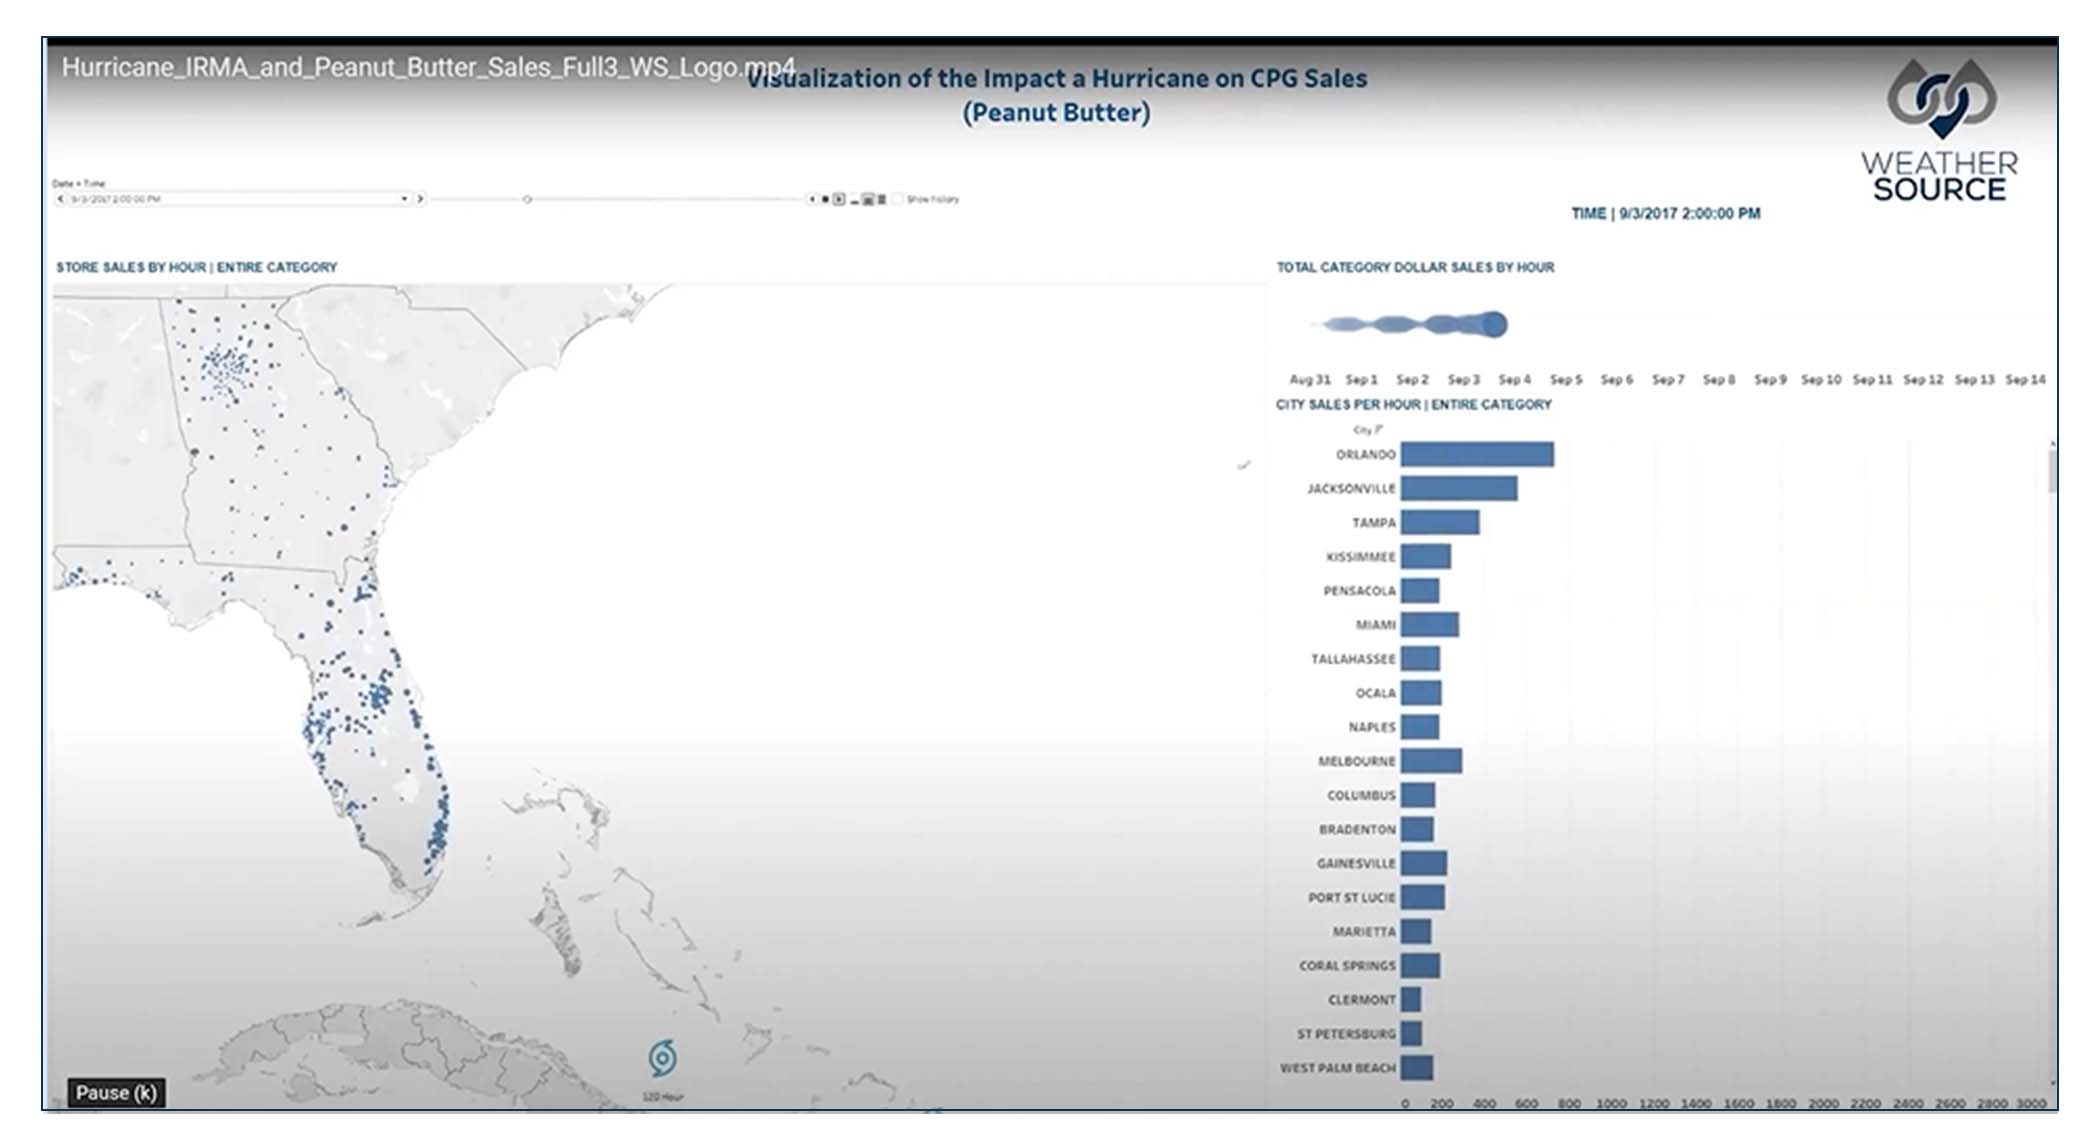
Image 1 shows peanut butter sales as hurricane forecasts began. 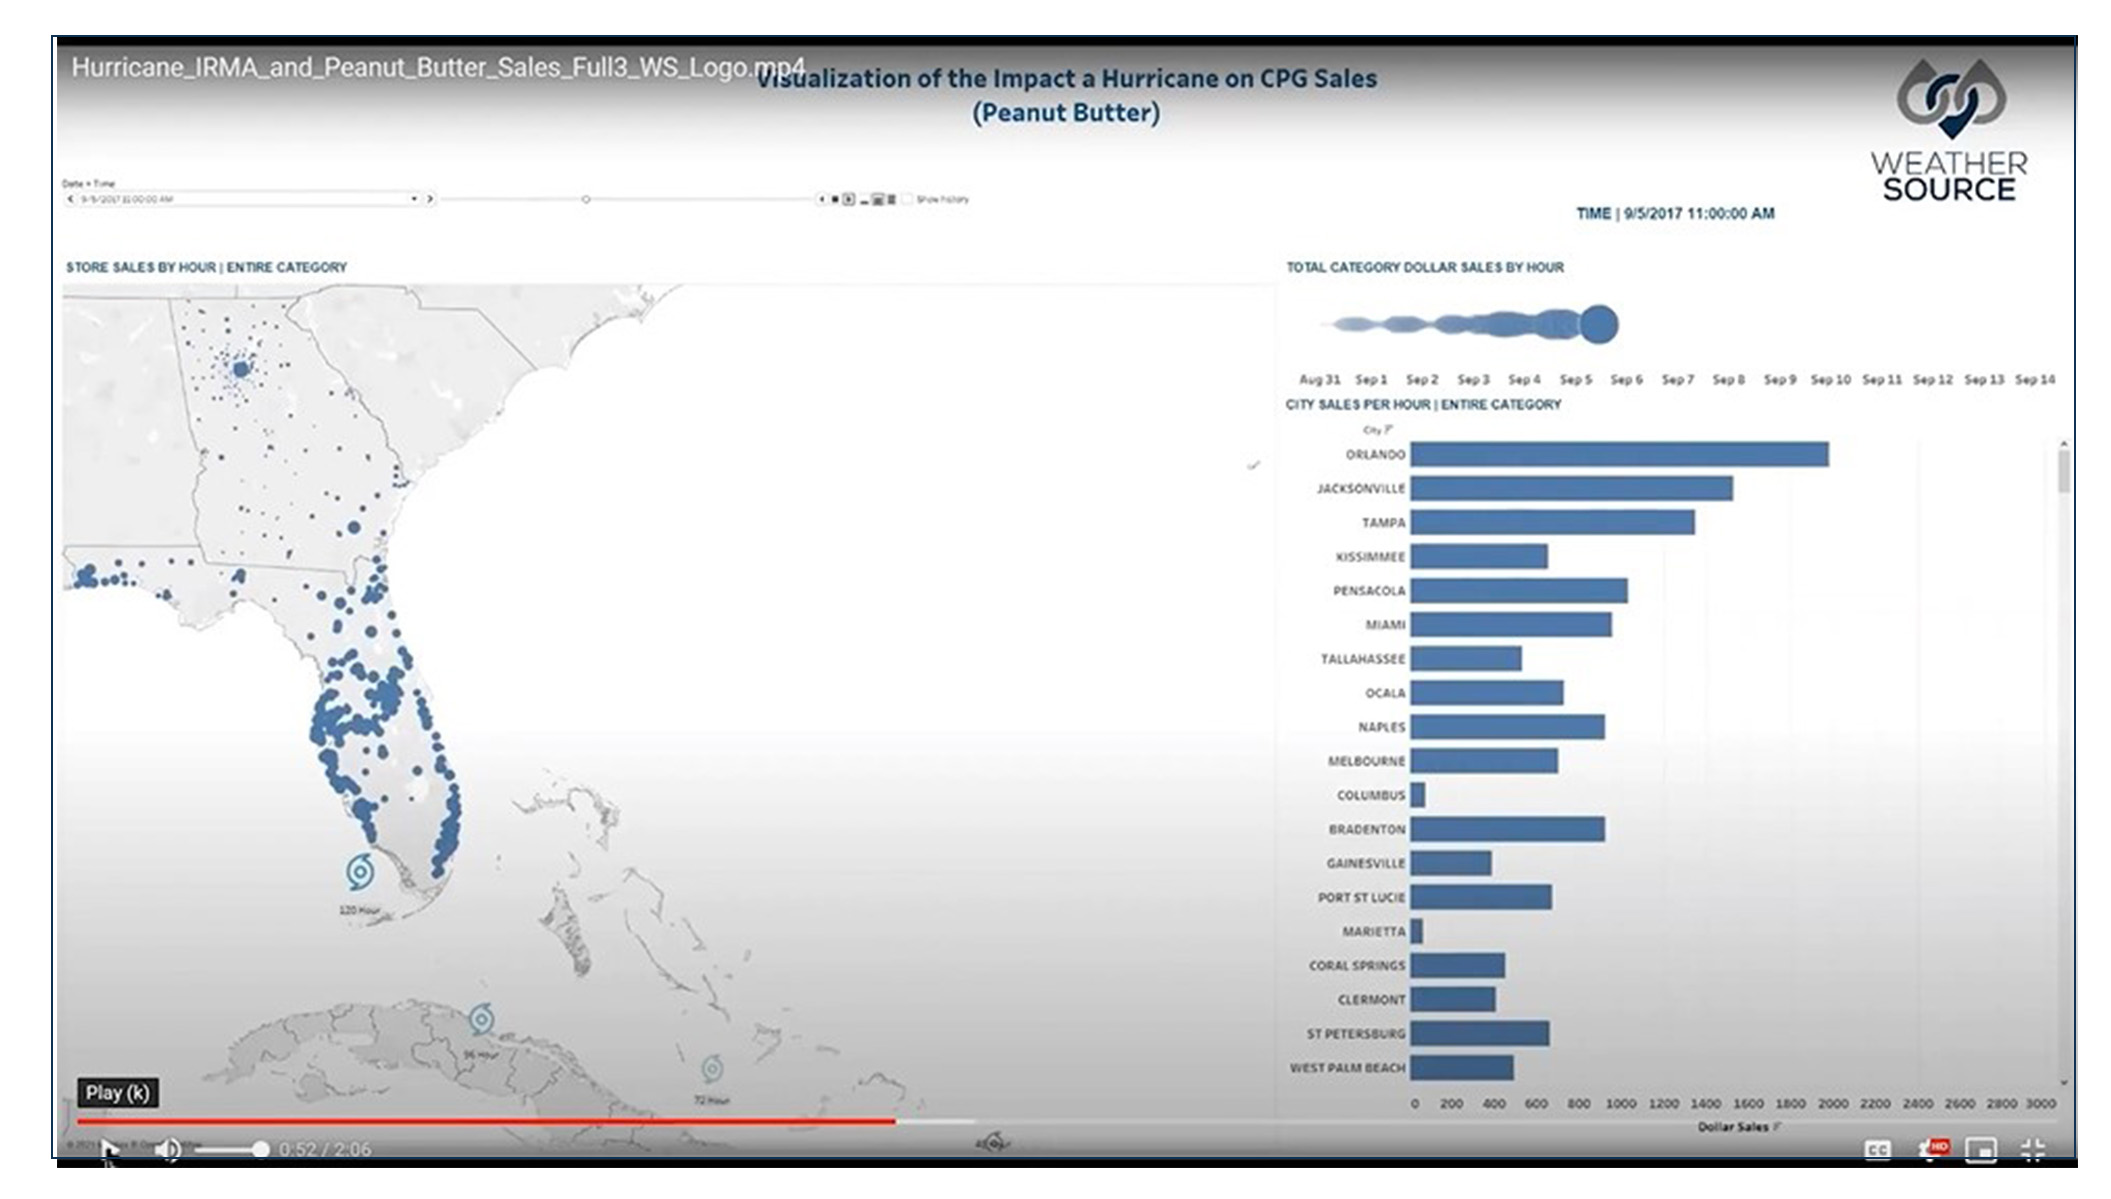
Image 2 shows peanut butter sales at the height of pre-storm shopping at the retailer.
What we uncovered was that this particular retailer found a huge increase in peanut butter sales (a 233% increase in daily peanut butter sales per hour at one point in Orlando) leading up to when the hurricane made landfall. This trend continued through the Southeastern states as the storm moved northerly. What is most interesting is that when the hurricane made landfall, the peanut butter sales completely flatlined as there was no further inventory in the south of Florida. This particular retailer was not prepared for the severe weather event with adequate inventory to meet the consumer demand and this was just one CPG SKU.
The entire video is available via Snowflake here (the Weather Source portion begins at the 14 minute mark). The most important thing to take away from this example is that building a weather strategy leads to better inventory management, which leads to maximized product sales.
This is just one example of how Weather Source works with data and, in turn, empowers its clients to be more prepared for severe weather like hurricanes, this can easily be translated for use in other weather instances as well.
Weather Source’s products were designed for the rigors of data analytics. Weather Source’s OnPoint Weather Product Suite provides global historical weather in hourly and daily format back to 2000 to present and with a 42-day forward forecast. In addition, we also have historical forecast data in pristine format in both hourly and daily format. The fact that we have a rich, statistically consistent historical dataset makes the data perfect for back testing and then building predictive models to reduce and mitigate risk, support and optimize business mandates and better forecast the impact of weather on precise business locations all from a single source of truth.
In addition, we have deep history and OnPoint Geospatial products that help organizations visualize severe weather and perils. For example, geospatial products can illustrate what path a hurricane took on a particular day or where in a region people will be affected by certain temperatures. Weather Source has geospatial products for all perils including hurricanes, hail, tornadoes, flooding, wildfires, storm surge, severe convective weather and more.
Are you ready for Victor? He is on the horizon and coming next. We are ready to help you build your weather strategy, talk to us about how we can help.


